

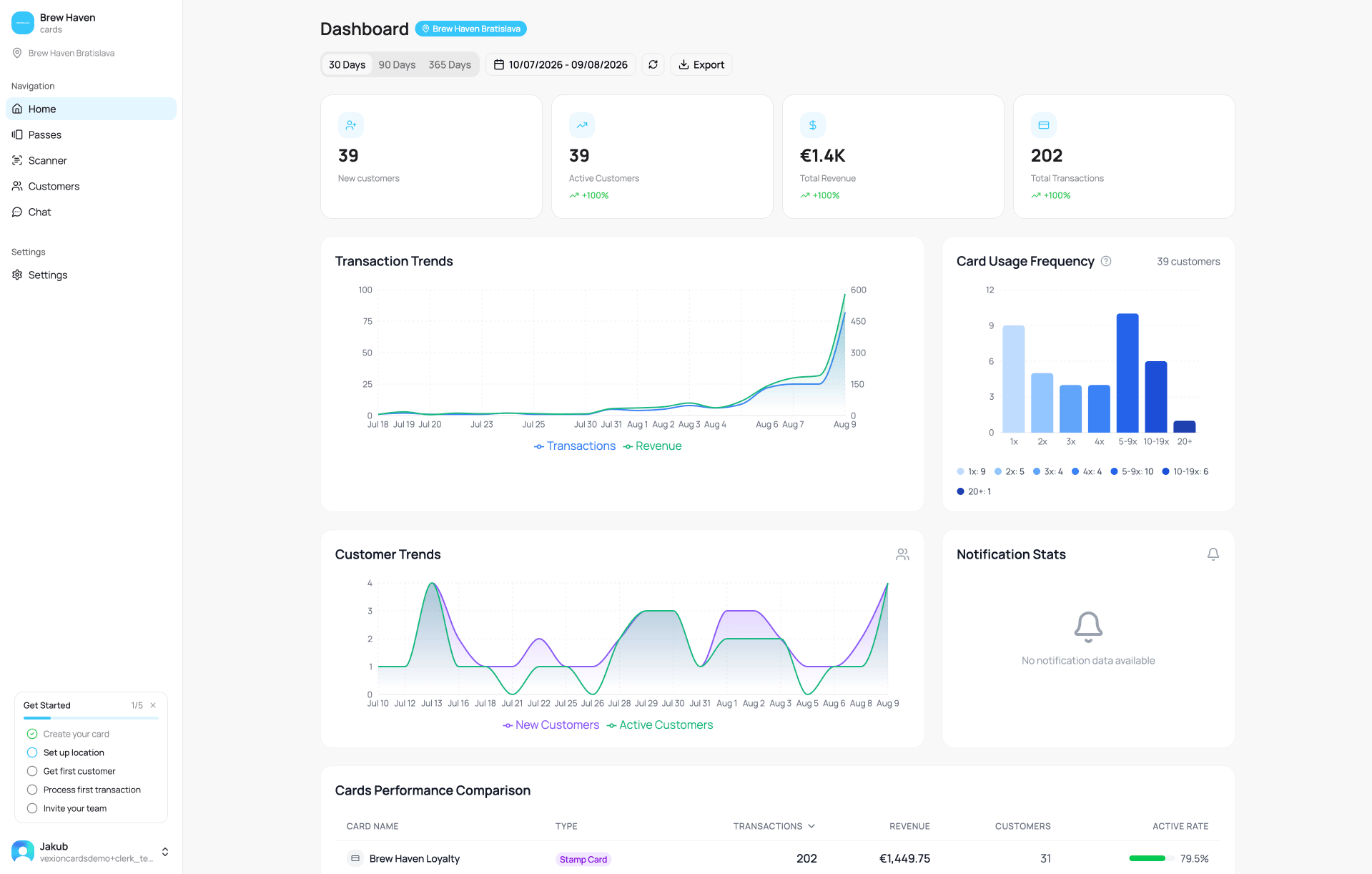
The Home dashboard
Every panel stays on the screen even when there is nothing to show yet. A panel with no data for the selected period displays a short “No data available” message instead of a chart, so a quiet week looks empty rather than hidden.
Choosing the time period
Everything on the dashboard is filtered by the period you pick at the top:- 30 Days / 90 Days / 365 Days quick ranges.
- A custom date range using the calendar picker.
- A Refresh button to reload the latest numbers.
Filtering by location
If you have more than one location, the location selector in the sidebar scopes the whole dashboard alongside the time period. Leave it on All Locations to see everything combined, or pick one or more stores to see just their numbers. When a location filter is active, a blue chip next to the page title shows which store(s) you are viewing, and you may see a small note such as “12 records in this period have no assigned location”, transactions not tied to any store (usually older ones). It only appears when you have filtered to a location.With a location filter active, the tiles and charts below reflect only that location. The New customers tile counts sign-ups at that location. Customer Trends counts customers who made a transaction at that location. Notification Stats always show all locations, because a push goes to every location. See Filtering by Location & Time for the full picture.
The four headline numbers (KPIs)

KPI tiles
Transaction Trends
A line chart with two axes: Transactions (left) and Revenue (right), plotted over the selected period. Use it to spot busy days, quiet stretches, and how transaction volume tracks against revenue.Card Usage Frequency
Groups your active customers by how many times they used their card in the period, in buckets of 1x, 2x, 3x, 4x, 5-9x, 10-19x, and 20+.In the app, the “What does this show?” tooltip explains it directly: how many times each customer used their card during the selected period. For example, “2x” means customers who made exactly 2 transactions.
Customer Trends
An area chart with three lines per day:- New Customers: sign-ups that day.
- Active Customers: sign-ups that day that added the card to their wallet.
- Churned: sign-ups that day that later deleted the card.
Notification Stats
Delivery results for the push notifications you have sent: success rate and counts of sent, successful, and failed messages, with a breakdown by platform. If you have not sent any notifications yet, it shows “No notification data available”.Cards Performance Comparison
A table ranking your cards against each other, one row per card:
Use Show All Cards to expand the full list beyond the top rows.
Top Customers
Your best customers, ranked. Switch the ranking with the By Spend and By Visits tabs at the top. The columns show each customer’s spend, visits, average spend per visit, and last visit date.Activity Heatmap
Shows when your customers transact. Toggle between three views:- Day for the busiest days of the week.
- Hour for the busiest hours of the day.
- Day & Hour for both combined into a grid.
Event Breakdown
A breakdown of transactions by event type, for example Stamps Earned, Stamps Redeemed, Gift Card Spent, Gift Card Top-up, and Membership Used. It tells you what kind of loyalty activity is actually happening.Transaction sources
Where your transactions come from, grouped into channels: POS, E-shop, Booking, Manual and System. Hover a channel to see which integration fed it.Detailed per-card analytics (points economy, cashback, stamp completion funnels, gift-card health, and so on) live on each card’s own Analytics tab, not on this Home dashboard. Open a card from Passes to see them.
Tips and news in the sidebar
Admins and managers see a small stack of cards. On desktop it sits at the bottom of the sidebar. On a phone it sits at the top of Home, under the page title. The cards bring you:- Suggestions for your next step, such as sending a campaign, turning on location push, selling gift cards, or inviting your team.
- Milestones, such as reaching 100 customers.
- News about VEXiON cards.
- Maintenance notices.