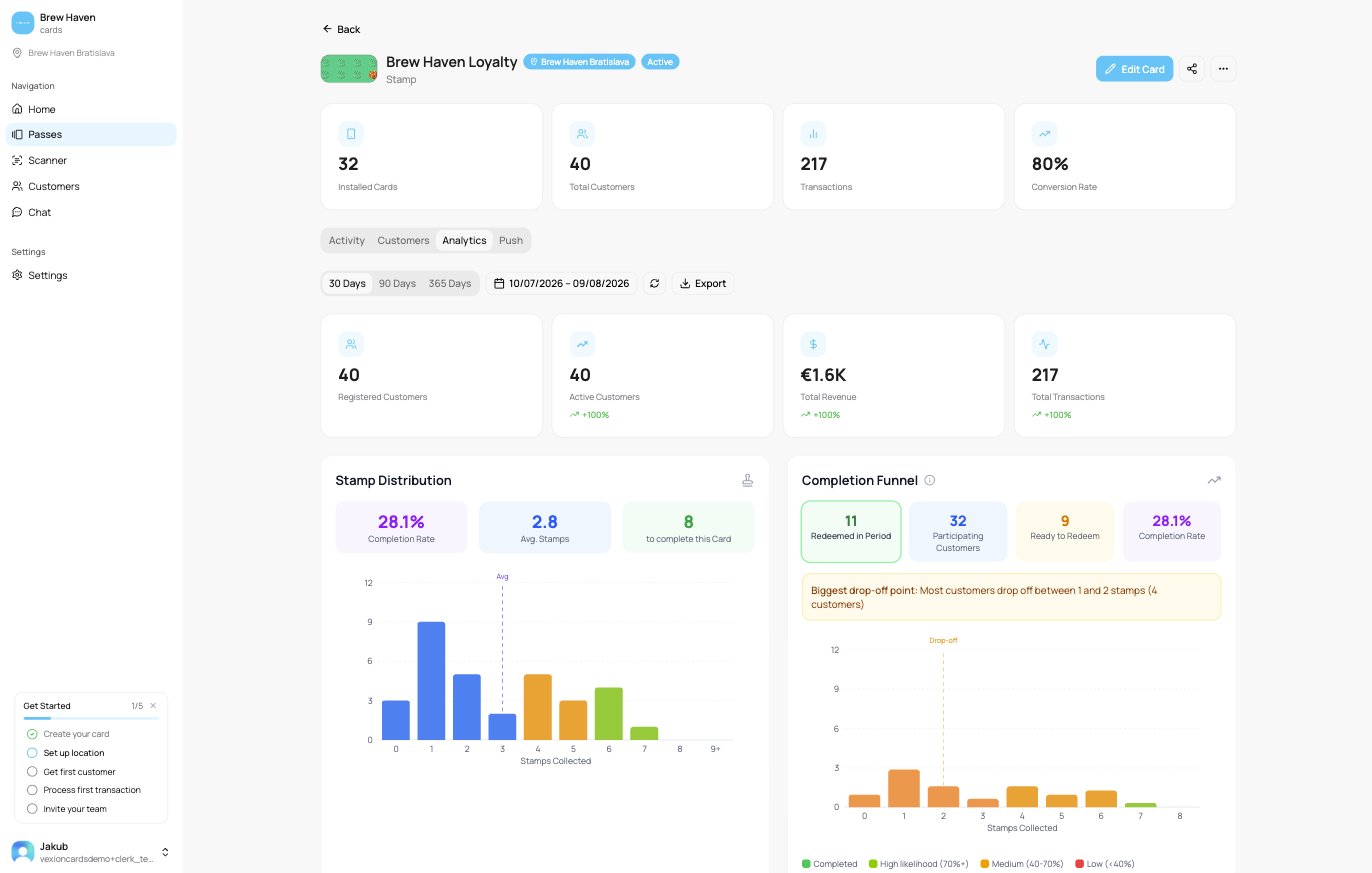
The Analytics tab for stamp cards, also with Paid in advance: completion, drop-off, and timing.
These panels appear on the Analytics tab of a Stamp Card, alongside the shared elements (time period, location, export, health score, heatmap, top customers).
Shows how far along your customers are: the Completion Rate, the average number of stamps collected, and how many stamps it takes to complete the card, with a bar chart of how many customers sit at each stamp count.
How customers progress toward the reward: Redeemed in Period, Participating Customers, Ready to Redeem, and the overall Completion Rate. It highlights the biggest drop-off point (where most customers stall) and colours each level by how likely those customers are to finish (high, medium, or low).
The timing of stamp collection: Average Days to Complete a Card, Average Days Between Stamps, Average Stamps per Week and per Customer, Total Stamps, Completions in Period, and the Fastest and Slowest completion.
A health score with four groups of customers: Active (activity in the last 30 days), At Risk (stamps but no activity for 30+ days), Repeat Completers (completed 2 or more cards), and Churned (no activity for 60+ days with an incomplete card).
For stamp cards you can rank your best customers By Stamps or By Visits, and By Spend when the card has spend data. The table shows their total and current stamps, visits, and last visit.