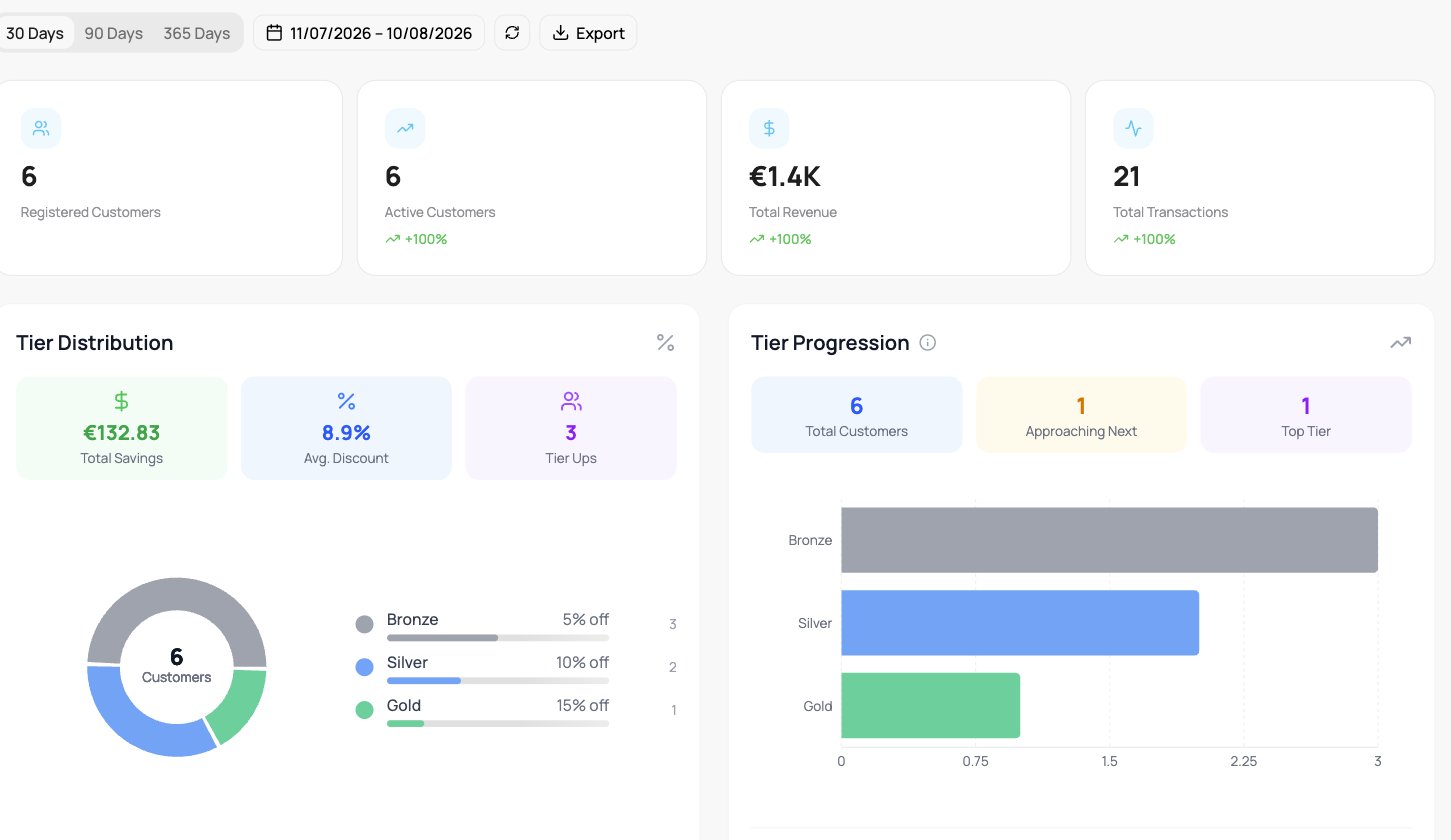
The Analytics tab for discount and employee cards: tiers, savings, and ROI.
These panels appear on the Analytics tab of a Discount Card or Employee Card, alongside the shared elements (time period, location, export, health score, heatmap, top customers).
Tier Distribution shows total savings, average discount, and tier ups, with how many customers sit in each tier. Tier Progression shows the total customers, how many are Approaching the Next tier, how many are at the Top Tier, and the flow between tiers.
Customer savings against business revenue over time: Total Savings, Period Savings, Period Revenue, Average Discount, plus average savings per transaction and how many customers received savings.
How the discount program is performing: a Program ROI Score, the Effective Discount Rate, Revenue per Customer, Discount Efficiency, Tier Upgrade Velocity, Savings per Customer, estimated LTV, and the totals for revenue, discounts, and net revenue.
Timing of tiers and spending: Days to First Tier, Days Between Transactions, Transactions per Week, Average Spend per Transaction, Spend Velocity, and Active Transactors, plus a time-to-tier breakdown.
The health score breaks customers into Active, Tier Upgrades, Dormant, Churned, and High Value. Top Customers can be ranked By Savings, By Spend, or By Visits.