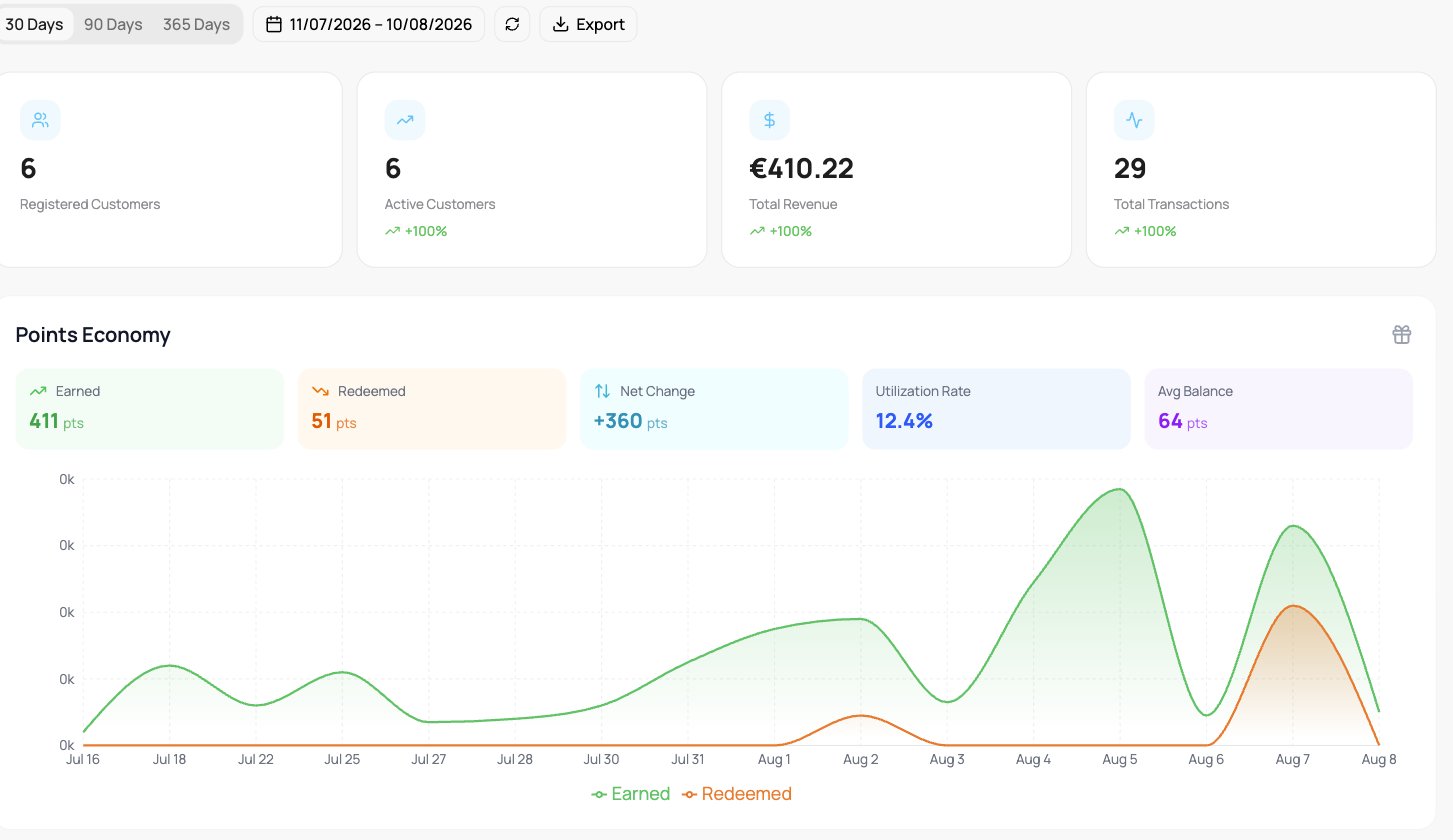
These panels appear on the Analytics tab of a Reward Card or Cashback Card (one level or more), alongside the shared elements (time period, location, export, health score, heatmap, top customers).
The Analytics tab of a reward card: summary tiles for Registered Customers, Active Customers, Total Revenue, and Total Transactions, then the Points Economy panel with Earned, Redeemed, Net Change, Utilization Rate, and Average Balance above an Earned-versus-Redeemed points trend chart.

Reward card analytics

Points Economy

The flow of points: points Earned, Redeemed, the Net Change, the Utilization Rate, and the average balance, with a points trend over time.

Reward cards: Points Distribution and Reward Distribution

A reward (points) card shows two panels:
  • Points Distribution: how customers are spread across points ranges, so you can see who is close to redeeming.
  • Reward Distribution: for each reward level, how many customers can redeem and how many have redeemed.

Cashback cards: Cashback Savings

Cashback cards (one level or more) show these panels instead:
  • Cashback Savings: how much value customers are getting back: Total Savings, Period Savings, Average per Redemption, Total Redemptions, and Average per Customer, plotted over time.
  • Points Distribution: how customers are spread across euro balance ranges (for example 0€, 0.01€ to 0.99€, 1€ to 4.99€, 5€ to 9.99€, 10€+).

Time Analytics

Timing of earning and redeeming: Days to First Redemption, Days Between Earns, Points per Week and per Customer, Total Points Earned, Active Earners, and the average earned per week. Reward cards show points. Cashback cards also show euro amounts.

Loyalty Health & Top Customers

The health score for points cards breaks customers into Active Earners, Active Redeemers, Dormant, Churned, and High Value. Top Customers can be ranked By Points, By Spend, or By Visits.